Profiling & Optimizing in Go
Brad Fitzpatrick
YAPC::Asia 2015
Tokyo Big Sight, 2015-08-22
See the intro slides.
Watch the video recording of this talk.
Requirements
If you’re following along at home, you’ll need the following:
- Go (1.4.2 or 1.5+ recommended)
- Graphviz (http://www.graphviz.org/)
- Linux (ideal), Windows, or OS X (requires pprof_mac_fix)
Starting program.
Let’s debug and optimize a simple HTTP server.
package main

import (
        "fmt"
        "log"
        "net/http"
        "regexp"
)

var visitors int

func handleHi(w http.ResponseWriter, r *http.Request) {
        if match, _ := regexp.MatchString(`^\w*$`, r.FormValue("color")); !match {
                http.Error(w, "Optional color is invalid", http.StatusBadRequest)
                return
        }
        visitors++
        w.Header().Set("Content-Type", "text/html; charset=utf-8")
        w.Write([]byte("<h1 style='color: " + r.FormValue("color") +
             "'>Welcome!</h1>You are visitor number " + fmt.Sprint(visitors) + "!"))
}

func main() {
        log.Printf("Starting on port 8080")
        http.HandleFunc("/hi", handleHi)
        log.Fatal(http.ListenAndServe("127.0.0.1:8080", nil))
}
Run it.
$ cd $GOPATH/src/github.com/bradfitz/talk-yapc-asia-2015/demo
$ go run demo.go
or
$ go build && ./demo
or
$ go install && demo
Testing
$ go test
?       yapc/demo       [no test files]
Uh oh. No tests. Let’s write some.
In demo_test.go:
package demo

import (
        "bufio"
        "net/http"
        "net/http/httptest"
        "strings"
        "testing"
)

func TestHandleRoot_Recorder(t *testing.T) {
        rw := httptest.NewRecorder()
        handleHi(rw, req(t, "GET / HTTP/1.0\r\n\r\n"))
        if !strings.Contains(rw.Body.String(), "visitor number") {
                t.Errorf("Unexpected output: %s", rw.Body)
        }
}

func req(t *testing.T, v string) *http.Request {
        req, err := http.ReadRequest(bufio.NewReader(strings.NewReader(v)))
        if err != nil {
                t.Fatal(err)
        }
        return req
}
Now:
$ go test -v
=== RUN   TestHandleHi_Recorder
--- PASS: TestHandleHi_Recorder (0.00s)
PASS
ok      yapc/demo       0.053s
This tests the HTTP handler with a simple in-memory implementation of
the ResponseWriter interface.
Another way to write an HTTP test is to use the actual HTTP client &
server, but with automatically created localhost addresses, using the
httptest pacakge:
func TestHandleHi_TestServer(t *testing.T) {
        ts := httptest.NewServer(http.HandlerFunc(handleHi))
        defer ts.Close()
        res, err := http.Get(ts.URL)
        if err != nil {
                t.Error(err)
                return
        }
	if g, w := res.Header.Get("Content-Type"), "text/html; charset=utf-8"; g != w {
		t.Errorf("Content-Type = %q; want %q", g, w)
	}
        slurp, err := ioutil.ReadAll(res.Body)
        defer res.Body.Close()
        if err != nil {
                t.Error(err)
                return
        }
        t.Logf("Got: %s", slurp)
}
Race detector.
Go has concurrency built-in to the language and automatically parallelizes code as necessary over any available CPUs. Unlike Rust, in Go you can write code with a data race if you’re not careful. A data race is when multiple goroutine access shared data concurrently without synchronization, when at least one of the gouroutines is doing a write.
Before we optimize our code, let’s ensure we have no data races.
Just run your tests with the -race flag:
$ go test -race
PASS
ok      yapc/demo       1.047s
All good, right?
Nope.
Go’s race detector does runtime analysis. It has no false positives, but it does have false negatives. If it doesn’t actually see a race, it can’t report it.
Let’s change our test to actually do two things at once:
func TestHandleHi_TestServer_Parallel(t *testing.T) {
	ts := httptest.NewServer(http.HandlerFunc(handleHi))
	defer ts.Close()
	var wg sync.WaitGroup
	for i := 0; i < 2; i++ {
		wg.Add(1)
		go func() {
			defer wg.Done()
			res, err := http.Get(ts.URL)
			if err != nil {
				t.Error(err)
				return
			}
			if g, w := res.Header.Get("Content-Type"), "text/html; charset=utf-8"; g != w {
				t.Errorf("Content-Type = %q; want %q", g, w)
			}
			slurp, err := ioutil.ReadAll(res.Body)
			defer res.Body.Close()
			if err != nil {
				t.Error(err)
				return
			}
			t.Logf("Got: %s", slurp)
		}()
	}
	wg.Wait()
}
Now we can run it again and see:
$ go test -v -race
=== RUN   TestHandleHi_Recorder
--- PASS: TestHandleHi_Recorder (0.00s)
=== RUN   TestHandleHi_TestServer
--- PASS: TestHandleHi_TestServer (0.00s)
        demo_test.go:46: Got: <h1 style='color: '>Welcome!</h1>You are visitor number 2!
=== RUN   TestHandleHi_TestServer_Parallel
==================
WARNING: DATA RACE
Read by goroutine 21:
  yapc/demo.handleHi()
      /Users/bradfitz/src/yapc/demo/demo.go:17 +0xf5
  net/http.HandlerFunc.ServeHTTP()
      /Users/bradfitz/go/src/net/http/server.go:1422 +0x47
  net/http/httptest.(*waitGroupHandler).ServeHTTP()
      /Users/bradfitz/go/src/net/http/httptest/server.go:200 +0xfe
  net/http.serverHandler.ServeHTTP()
      /Users/bradfitz/go/src/net/http/server.go:1862 +0x206
  net/http.(*conn).serve()
      /Users/bradfitz/go/src/net/http/server.go:1361 +0x117c

Previous write by goroutine 23:
  yapc/demo.handleHi()
      /Users/bradfitz/src/yapc/demo/demo.go:17 +0x111
  net/http.HandlerFunc.ServeHTTP()
      /Users/bradfitz/go/src/net/http/server.go:1422 +0x47
  net/http/httptest.(*waitGroupHandler).ServeHTTP()
      /Users/bradfitz/go/src/net/http/httptest/server.go:200 +0xfe
  net/http.serverHandler.ServeHTTP()
      /Users/bradfitz/go/src/net/http/server.go:1862 +0x206
  net/http.(*conn).serve()
      /Users/bradfitz/go/src/net/http/server.go:1361 +0x117c

Goroutine 21 (running) created at:
  net/http.(*Server).Serve()
      /Users/bradfitz/go/src/net/http/server.go:1912 +0x464

Goroutine 23 (running) created at:
  net/http.(*Server).Serve()
      /Users/bradfitz/go/src/net/http/server.go:1912 +0x464
==================
--- PASS: TestHandleHi_TestServer_Parallel (0.00s)
        demo_test.go:68: Got: <h1 style='color: '>Welcome!</h1>You are visitor number 3!
        demo_test.go:68: Got: <h1 style='color: '>Welcome!</h1>You are visitor number 4!
PASS
Found 1 data race(s)
exit status 66
FAIL    yapc/demo       1.056s
Now we can see that the write on line 17 (to the visitors variable)
conflicts with the read on line 17 (of the same variable). To make it
more obvious, change the code to:
    now := visitors + 1
    visitors = now
… and it’ll report different line numbers for each.
Fix the race!
If your code has data races, all bets are off and you’re just waiting for a crash. The runtime promises nothing if you have a data race.
Multiple options:
- use channels (“Do not communicate by sharing memory; instead, share memory by communicating.”)
- use a Mutex
- use atomic
Mutex
  var visitors struct {
    sync.Mutex
    n int
  }
...
  func foo() {
    ...
    visitors.Lock()
    visitors.n++
    yourVisitorNumber := visitors.n
    visitors.Unlock()
Atomic
  var visitors int64 // must be accessed atomically
...
  func foo() {
    ...
    visitNum := atomic.AddInt64(&visitors, 1)
How fast can it go? CPU Profiling!
To use Go’s CPU profiling, it’s easiest to first write a Benchmark
function, which is very similar to a Test function.
func BenchmarkHi(b *testing.B) {
        b.ReportAllocs()
        r := req(b, "GET / HTTP/1.0\r\n\r\n")
        for i := 0; i < b.N; i++ {
                rw := httptest.NewRecorder()
                handleHi(rw, r)
        }
}
(and change func req to take the testing.TB interface instead, so
it can take a *testing.T or a *testing.B)
Now we can run the benchmarks:
$ go test -v -run=^$ -bench=.
PASS
BenchmarkHi-4     100000             12843 ns/op
ok      yapc/demo       1.472s
Play with flags, like -benchtime.
Is that fast? Slow? Your decision.
But let’s see where the CPU is going now….
CPU Profiling
$ go test -v -run=^$ -bench=^BenchmarkHi$ -benchtime=2s -cpuprofile=prof.cpu
(Leaves demo.test binary behind)
Now, let’s use the Go profile viewer:
$ go tool pprof demo.test prof.cpu
Entering interactive mode (type "help" for commands)

(pprof) top
3070ms of 3850ms total (79.74%)
Dropped 62 nodes (cum <= 19.25ms)
Showing top 10 nodes out of 92 (cum >= 290ms)
      flat  flat%   sum%        cum   cum%
    1710ms 44.42% 44.42%     1710ms 44.42%  runtime.mach_semaphore_signal
     290ms  7.53% 51.95%     1970ms 51.17%  runtime.growslice
     230ms  5.97% 57.92%      230ms  5.97%  runtime.mach_semaphore_wait
     200ms  5.19% 63.12%     2270ms 58.96%  runtime.mallocgc
     160ms  4.16% 67.27%      160ms  4.16%  runtime.heapBitsSetType
     110ms  2.86% 70.13%      210ms  5.45%  runtime.mapassign1
     110ms  2.86% 72.99%      110ms  2.86%  runtime.memclr
     100ms  2.60% 75.58%      640ms 16.62%  regexp.makeOnePass.func2
     100ms  2.60% 78.18%      100ms  2.60%  runtime.memmove
      60ms  1.56% 79.74%      290ms  7.53%  runtime.makeslice

(pprof) top --cum
0.26s of 3.85s total ( 6.75%)
Dropped 62 nodes (cum <= 0.02s)
Showing top 10 nodes out of 92 (cum >= 2.22s)
      flat  flat%   sum%        cum   cum%
         0     0%     0%      3.55s 92.21%  runtime.goexit
         0     0%     0%      3.48s 90.39%  testing.(*B).launch
         0     0%     0%      3.48s 90.39%  testing.(*B).runN
     0.01s  0.26%  0.26%      3.47s 90.13%  yapc/demo.BenchmarkHi
     0.01s  0.26%  0.52%      3.44s 89.35%  yapc/demo.handleHi
         0     0%  0.52%      3.30s 85.71%  regexp.MatchString
     0.01s  0.26%  0.78%         3s 77.92%  regexp.Compile
         0     0%  0.78%      2.99s 77.66%  regexp.compile
     0.20s  5.19%  5.97%      2.27s 58.96%  runtime.mallocgc
     0.03s  0.78%  6.75%      2.22s 57.66%  regexp.compileOnePass

(pprof) list handleHi
Total: 3.85s
ROUTINE ======================== yapc/demo.handleHi in /Users/bradfitz/src/yapc/demo/demo.go
      10ms      3.44s (flat, cum) 89.35% of Total
         .          .      8:)
         .          .      9:
         .          .     10:var visitors int
         .          .     11:
         .          .     12:func handleHi(w http.ResponseWriter, r *http.Request) {
         .      3.30s     13:   if match, _ := regexp.MatchString(\w*$r.FormValue("color")); !match {
         .          .     14:           http.Error(w, "Optional color is invalid", http.StatusBadRequest)
         .          .     15:           return
         .          .     16:   }
      10ms       10ms     17:   visitors++
         .       50ms     18:   w.Header().Set("Content-Type", "text/html; charset=utf-8")
         .       80ms     19:   w.Write([]byte("<h1 style='color: " + r.FormValue("color") + "'>Welcome!</h1>You are visitor number " + fmt.Sprint(visitors) + "!"))
         .          .     20:}
         .          .     21:
         .          .     22:func main() {
         .          .     23:   log.Printf("Starting on port 8080")
         .          .     24:   http.HandleFunc("/hi", handleHi)

(pprof) web
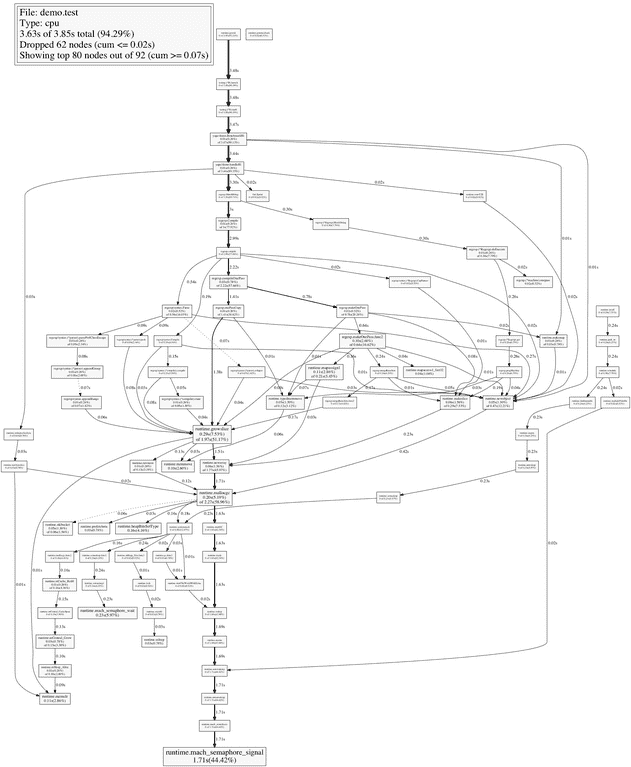
3 seconds in regexp.MatchString? CPU profiling shows 85.71% of the
cumulative time in MatchString, 77.92% in regexp compilation, and
58.96% in garbage collection (which is triggered via allocations).
Allocate less => fewer GCs.
Why are we allocating?
Memory profiling
$ go tool pprof --alloc_space demo.test prof.mem
(pprof) top
1159.72MB of 1485.25MB total (78.08%)
Dropped 12 nodes (cum <= 7.43MB)
Showing top 10 nodes out of 33 (cum >= 1484.75MB)
      flat  flat%   sum%        cum   cum%
  294.10MB 19.80% 19.80%   294.10MB 19.80%  regexp.onePassCopy
  174.53MB 11.75% 31.55%   174.53MB 11.75%  regexp.progMachine
  119.03MB  8.01% 39.57%   170.54MB 11.48%  regexp/syntax.(*compiler).compile
  106.53MB  7.17% 46.74%   106.53MB  7.17%  net/textproto.MIMEHeader.Set
  100.51MB  6.77% 53.51%   308.51MB 20.77%  regexp.makeOnePass
      99MB  6.67% 60.17%   208.01MB 14.00%  regexp.makeOnePass.func2
   84.50MB  5.69% 65.86%    84.50MB  5.69%  regexp.mergeRuneSets.func2
   69.51MB  4.68% 70.54%    80.01MB  5.39%  regexp/syntax.(*parser).op
   58.51MB  3.94% 74.48%   242.02MB 16.30%  regexp/syntax.Parse
   53.50MB  3.60% 78.08%  1484.75MB   100%  yapc/demo.BenchmarkHi

(pprof) top --cum
249.02MB of 1485.25MB total (16.77%)
Dropped 12 nodes (cum <= 7.43MB)
Showing top 10 nodes out of 33 (cum >= 308.51MB)
      flat  flat%   sum%        cum   cum%
         0     0%     0%  1484.75MB   100%  runtime.goexit
         0     0%     0%  1484.75MB   100%  testing.(*B).launch
         0     0%     0%  1484.75MB   100%  testing.(*B).runN
   53.50MB  3.60%  3.60%  1484.75MB   100%  yapc/demo.BenchmarkHi
   52.50MB  3.53%  7.14%  1431.25MB 96.36%  yapc/demo.handleHi
         0     0%  7.14%  1265.21MB 85.18%  regexp.MatchString
         0     0%  7.14%  1087.18MB 73.20%  regexp.Compile
   42.51MB  2.86% 10.00%  1087.18MB 73.20%  regexp.compile
         0     0% 10.00%   602.61MB 40.57%  regexp.compileOnePass
  100.51MB  6.77% 16.77%   308.51MB 20.77%  regexp.makeOnePass

(pprof) list BenchmarkHi
Total: 1.45GB
ROUTINE ======================== yapc/demo.BenchmarkHi in /Users/bradfitz/src/yapc/demo/demo_test.go
   53.50MB     1.45GB (flat, cum)   100% of Total
         .          .     72:}
         .          .     73:
         .          .     74:func BenchmarkHi(b *testing.B) {
         .          .     75:   r := req(b, "GET / HTTP/1.0\r\n\r\n")
         .          .     76:   for i := 0; i < b.N; i++ {
   53.50MB    53.50MB     77:           rw := httptest.NewRecorder()
         .     1.40GB     78:           handleHi(rw, r)
         .          .     79:   }
         .          .     80:}

(pprof) list handleHi
Total: 1.45GB
ROUTINE ======================== yapc/demo.handleHi in /Users/bradfitz/src/yapc/demo/demo.go
   52.50MB     1.40GB (flat, cum) 96.36% of Total
         .          .      8:)
         .          .      9:
         .          .     10:var visitors int
         .          .     11:
         .          .     12:func handleHi(w http.ResponseWriter, r *http.Request) {
         .     1.24GB     13:   if match, _ := regexp.MatchString(\w*$r.FormValue("color")); !match {
         .          .     14:           http.Error(w, "Optional color is invalid", http.StatusBadRequest)
         .          .     15:           return
         .          .     16:   }
         .          .     17:   visitors++
         .   106.53MB     18:   w.Header().Set("Content-Type", "text/html; charset=utf-8")
   52.50MB    59.50MB     19:   w.Write([]byte("<h1 style='color: " + r.FormValue("color") + "'>Welcome!</h1>You are visitor number " + fmt.Sprint(visitors) + "!"))
         .          .     20:}
         .          .     21:
         .          .     22:func main() {
         .          .     23:   log.Printf("Starting on port 8080")
         .          .     24:   http.HandleFunc("/hi", handleHi)
Let’s compile that regexp just once
var colorRx = regexp.MustCompile(`\w*$`)
...
  if !colorRx.MatchString(r.FormValue("color")) {
And now:
$ go test -bench=.
PASS
BenchmarkHi-4    1000000              1451 ns/op
ok      yapc/demo       1.517s
10x faster!
Let’s compare CPU now:
bradfitz@laptop demo$ go test -v -run=^$ -bench=. -benchtime=3s -memprofile=prof.mem -cpuprofile=prof.cpu
PASS
BenchmarkHi-4    3000000              1420 ns/op
ok      yapc/demo       5.768s
bradfitz@laptop demo$ profcpu
Entering interactive mode (type "help" for commands)
(pprof) top --cum 30
2.78s of 6.24s total (44.55%)
Dropped 75 nodes (cum <= 0.03s)
Showing top 30 nodes out of 114 (cum >= 0.67s)
      flat  flat%   sum%        cum   cum%
         0     0%     0%      4.84s 77.56%  runtime.goexit
         0     0%     0%      3.72s 59.62%  testing.(*B).launch
         0     0%     0%      3.72s 59.62%  testing.(*B).runN
     0.02s  0.32%  0.32%      3.71s 59.46%  yapc/demo.BenchmarkHi
         0     0%  0.32%      3.04s 48.72%  yapc/demo.handleHi
     0.37s  5.93%  6.25%      2.55s 40.87%  runtime.mallocgc
     2.16s 34.62% 40.87%      2.16s 34.62%  runtime.mach_semaphore_signal
         0     0% 40.87%      2.16s 34.62%  runtime.mach_semrelease
         0     0% 40.87%      2.16s 34.62%  runtime.notewakeup
         0     0% 40.87%      2.16s 34.62%  runtime.semawakeup
         0     0% 40.87%      2.03s 32.53%  runtime.startm
         0     0% 40.87%      2.02s 32.37%  runtime.wakep
         0     0% 40.87%      1.83s 29.33%  runtime.systemstack
         0     0% 40.87%      1.54s 24.68%  runtime.ready
         0     0% 40.87%      1.54s 24.68%  runtime.startGC
         0     0% 40.87%      1.32s 21.15%  runtime.schedule
     0.02s  0.32% 41.19%      1.21s 19.39%  runtime.mcall
     0.01s  0.16% 41.35%      1.06s 16.99%  runtime.semasleep.func1
         0     0% 41.35%      1.05s 16.83%  runtime.semasleep1
         0     0% 41.35%      1.01s 16.19%  runtime.concatstring5
     0.11s  1.76% 43.11%      1.01s 16.19%  runtime.concatstrings
     0.01s  0.16% 43.27%      0.94s 15.06%  runtime.rawstringtmp
     0.03s  0.48% 43.75%      0.93s 14.90%  runtime.rawstring
     0.01s  0.16% 43.91%      0.75s 12.02%  runtime.stringtoslicebyte
     0.02s  0.32% 44.23%      0.74s 11.86%  runtime.rawbyteslice
         0     0% 44.23%      0.73s 11.70%  runtime.stopm
     0.02s  0.32% 44.55%      0.70s 11.22%  runtime.newobject
         0     0% 44.55%      0.69s 11.06%  runtime.semasleep
         0     0% 44.55%      0.67s 10.74%  runtime.findrunnable
         0     0% 44.55%      0.67s 10.74%  runtime.goschedImpl

(pprof) bradfitz@laptop demo$ profmem
Entering interactive mode (type "help" for commands)
(pprof) top --cum
2739.53MB of 2740.53MB total (  100%)
Dropped 9 nodes (cum <= 13.70MB)
      flat  flat%   sum%        cum   cum%
         0     0%     0%  2740.03MB   100%  runtime.goexit
         0     0%     0%  2740.03MB   100%  testing.(*B).launch
         0     0%     0%  2740.03MB   100%  testing.(*B).runN
  728.06MB 26.57% 26.57%  2740.03MB   100%  yapc/demo.BenchmarkHi
  561.03MB 20.47% 47.04%  2011.98MB 73.42%  yapc/demo.handleHi
         0     0% 47.04%  1382.94MB 50.46%  net/http.Header.Set
 1382.94MB 50.46% 97.50%  1382.94MB 50.46%  net/textproto.MIMEHeader.Set
   67.50MB  2.46%   100%       68MB  2.48%  fmt.Sprint
(pprof)

(pprof) list handleHi
Total: 2.68GB
ROUTINE ======================== yapc/demo.handleHi in /Users/bradfitz/src/yapc/demo/demo.go
  561.03MB     1.96GB (flat, cum) 73.42% of Total
         .          .     15:   if !colorRx.MatchString(r.FormValue("color")) {
         .          .     16:           http.Error(w, "Optional color is invalid", http.StatusBadRequest)
         .          .     17:           return
         .          .     18:   }
         .          .     19:   visitors++
         .     1.35GB     20:   w.Header().Set("Content-Type", "text/html; charset=utf-8")
  561.03MB   629.03MB     21:   w.Write([]byte("<h1 style='color: " + r.FormValue("color") + "'>Welcome!</h1>You are visitor number " + fmt.Sprint(visitors) + "!"))
         .          .     22:}
         .          .     23:
         .          .     24:func main() {
         .          .     25:   log.Printf("Starting on port 8080")
         .          .     26:   http.HandleFunc("/hi", handleHi)
Optimize memory
- Remove Content-Type header line (the
net/httpServer will do it for us) - use
fmt.Fprintf(w, ...instead of concats
Benchcmp
$ go test -bench=. -memprofile=prof.mem | tee mem.0
... (fix)
$ go test -bench=. -memprofile=prof.mem | tee mem.1
... (fix)
$ go test -bench=. -memprofile=prof.mem | tee mem.2

$ benchcmp mem.0 mem.2
benchmark         old ns/op     new ns/op     delta
BenchmarkHi-4     1180          964           -18.31%

benchmark         old allocs     new allocs     delta
BenchmarkHi-4     9              5              -44.44%

benchmark         old bytes     new bytes     delta
BenchmarkHi-4     720           224           -68.89%
Quite an improvement. Now, where is the memory coming from?
- profmem, see & fix the ResponseRecorder:
func BenchmarkHi(b *testing.B) {
        b.ReportAllocs()
        r := req(b, "GET / HTTP/1.0\r\n\r\n")
        rw := httptest.NewRecorder()
        for i := 0; i < b.N; i++ {
                handleHi(rw, r)
                reset(rw)
        }
}

func reset(rw *httptest.ResponseRecorder) {
        m := rw.HeaderMap
        for k := range m {
                delete(m, k)
        }
        body := rw.Body
        body.Reset()
        *rw = httptest.ResponseRecorder{
                Body:      body,
                HeaderMap: m,
        }
}
Now:
$ go test -bench=. -memprofile=prof.mem | tee mem.3
PASS
BenchmarkHi-4    2000000               649 ns/op              32 B/op          2 allocs/op
Where is that?
(pprof) top --cum 10
88MB of 88MB total (  100%)
      flat  flat%   sum%        cum   cum%
         0     0%     0%    87.50MB 99.43%  runtime.goexit
         0     0%     0%    87.50MB 99.43%  testing.(*B).launch
         0     0%     0%    87.50MB 99.43%  testing.(*B).runN
         0     0%     0%    87.50MB 99.43%  yapc/demo.BenchmarkHi
   87.50MB 99.43% 99.43%    87.50MB 99.43%  yapc/demo.handleHi
    0.50MB  0.57%   100%     0.50MB  0.57%  runtime.malg
         0     0%   100%     0.50MB  0.57%  runtime.mcommoninit
         0     0%   100%     0.50MB  0.57%  runtime.mpreinit
         0     0%   100%     0.50MB  0.57%  runtime.rt0_go
         0     0%   100%     0.50MB  0.57%  runtime.schedinit

(pprof) list handleHi
Total: 88MB
ROUTINE ======================== yapc/demo.handleHi in /Users/bradfitz/src/yapc/demo/demo.go
   87.50MB    87.50MB (flat, cum) 99.43% of Total
         .          .     24:   visitors.n++
         .          .     25:   num := visitors.n
         .          .     26:   visitors.Unlock()
         .          .     27:   //      w.Header().Set("Content-Type", "text/html; charset=utf-8")
         .          .     28:
   87.50MB    87.50MB     29:   fmt.Fprintf(w, "<h1 style='color: %s'>Welcome!</h1>You are visitor number %d!", r.FormValue("color"), num)
         .          .     30:}
         .          .     31:
         .          .     32:func main() {
         .          .     33:   log.Printf("Starting on port 8080")
         .          .     34:   http.HandleFunc("/hi", handleHi)

(pprof) disasm handleHi
...
         .          .      831f7: LEAQ 0x70(SP), BX
         .          .      831fc: MOVQ BX, 0x8(SP)
         .          .      83201: MOVQ $0x0, 0x10(SP)
      43MB       43MB      8320a: CALL runtime.convT2E(SB)
         .          .      8320f: MOVQ 0x18(SP), CX
         .          .      83214: MOVQ 0x20(SP), AX
...
Runtime representation of Go data structures.
See slides: Go built-in data structures
A Go interface is 2 words of memory: (type, pointer).
A Go string is 2 words of memory: (base pointer, length)
A Go slice is 3 words of memory: (base pointer, length, capacity)
Knowing that, let’s look at those 32 bytes/op.
The Go line is:
   fmt.Fprintf(w, "<h1 style='color: %s'>Welcome!</h1>You are visitor number %d!",
               r.FormValue("color"), num)
The function signature for fmt.Fprintf is:
$ go doc fmt.Fprintf
func Fprintf(w io.Writer, format string, a ...interface{}) (n int, err error)

    Fprintf formats according to a format specifier and writes to w. It returns
    the number of bytes written and any write error encountered.
Those interface values are 16 bytes each. They’re passed by value, but
the data word of an interface must be a pointer, and because string
is a compound value of 2 words (larger than the 1 word of data) and
int isn’t a pointer, the conversion from a type to an empty
interface (runtime.convT2E) allocates 16 bytes for each (the
smallest allocation size on 64-bit) and puts a pointer to the
allocation in the data word of the interface value.
Jump to this part in the slides now:
Removing all allocations
You probably don’t actually want to write code like this, but when it matters, you can do something like:
var bufPool = sync.Pool{
        New: func() interface{} {
                return new(bytes.Buffer)
        },
}
… to make a per-processor buffer pool at global scope, and then in the handler:
        buf := bufPool.Get().(*bytes.Buffer)
        defer bufPool.Put(buf)
        buf.Reset()
        buf.WriteString("<h1 style='color: ")
        buf.WriteString(r.FormValue("color"))
        buf.WriteString(">Welcome!</h1>You are visitor number ")
        b := strconv.AppendInt(buf.Bytes(), int64(num), 10)
        b = append(b, '!')
        w.Write(b)
Contention profiling
First, write a parallel benchmark:
func BenchmarkHiParallel(b *testing.B) {
        r := req(b, "GET / HTTP/1.0\r\n\r\n")
        b.RunParallel(func(pb *testing.PB) {
                rw := httptest.NewRecorder()
                for pb.Next() {
                        handleHi(rw, r)
                        reset(rw)
                }
        })
}
And measure:
$ go test -bench=Parallel -blockprofile=prof.block
And “fix”:
var colorRxPool = sync.Pool{
        New: func() interface{} { return regexp.MustCompile(`\w*$`) },
}
...
func handleHi(w http.ResponseWriter, r *http.Request) {
        if !colorRxPool.Get().(*regexp.Regexp).MatchString(r.FormValue("color")) {
                http.Error(w, "Optional color is invalid", http.StatusBadRequest)
                return
        }
What about that visitors mutex?
Let’s pull it out into a func:
        num := nextVisitorNum()
...
func nextVisitorNum() int {
	visitors.Lock()
	defer visitors.Unlock()
	visitors.n++
	return visitors.n
}
And write some benchmarks:
func BenchmarkVisitCount(b *testing.B) {
        b.RunParallel(func(pb *testing.PB) {
                for pb.Next() {
                        incrementVisitorNum()
                }
        })
}
Try:
- without defer
- with
int(atomic.AddInt64(&atomicVisitors, 1))
Coverage
$ go test -cover -coverprofile=cover
PASS
coverage: 54.8% of statements
ok      yapc/demo       0.066s
$ go tool cover -html=cover
(opens web browser)